INTERNAL INFRASTRUCTURE · MONITORING & OPERATIONS
In active useHeimdal — a shared view of project health and operations.
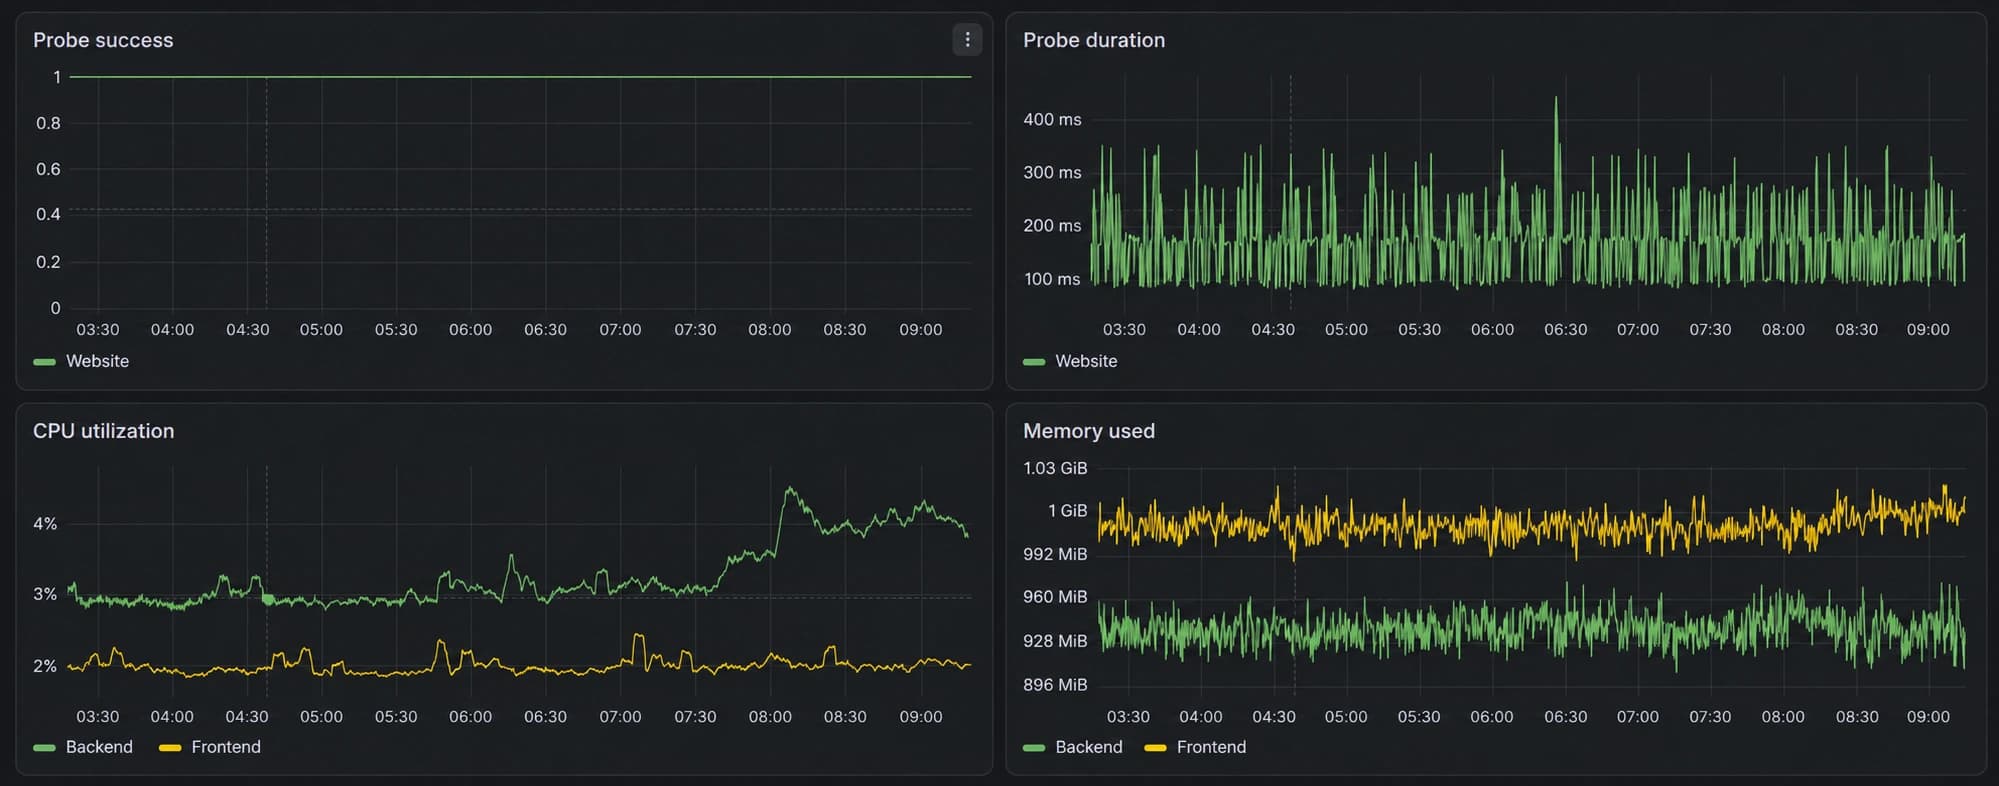
Athra's internal monitoring infrastructure brings service health, logs, errors, resource usage, and alerts together, with project-scoped customer views and off-host recovery workflows.
Dashboard visual · adapted from a real screenshot
- Project type
- Athra internal infrastructure
- Status
- In active use
- Focus
- Multi-project monitoring & operations
- Access
- Private operator & scoped customer views
The operational goal
Give the team one place to investigate project health across application hosts, services, logs, and errors. Bring alerting, usage history, and recovery into the same operational approach, with clear separation between projects.
What we built
We combined self-hosted observability tools with custom ingestion, project identity, access controls, usage reporting, and repeatable provisioning. Grafana is the investigation interface; the surrounding services connect collection, customer views, alerts, and recovery.
Beyond a dashboard
Service & resource monitoring
Track endpoint probes, response times, host and container resources, and the freshness of collected signals.
Central logs & error investigation
Bring application logs and browser/server errors into a central workflow, with release diagnostics for supported integrations.
Alerts & independent watchdog
Route alerts to Telegram and use a separate watchdog to detect loss of the monitoring platform's heartbeat.
Scoped customer dashboards
Dedicated customer views expose approved project metrics through a server-side query boundary.
Per-project usage history
Keep resource-usage history and versioned reports, with ownership and data-coverage tracking.
Backup & recovery workflows
Encrypted off-host backups and restore-verification procedures cover the monitoring platform's durable data and configuration.
From signals to action.
A simplified view of the platform's responsibilities, without exposing private hosts, credentials, or customer data.
Collect
Application hosts, containers, endpoint probes, logs, and browser/server errors.
Organise
Project identity, collection policies, metrics, logs, errors, and durable usage records.
Investigate
Grafana dashboards, error diagnostics, and project-scoped customer views.
Respond
Telegram alerts, independent monitoring checks, and backup/recovery procedures.
Monitoring the monitor
A separately hosted watchdog checks the platform heartbeat. Its alert path helps the team notice a monitoring outage as well as application problems.
Customer access is enforced on the server
Customer organizations use a dedicated query service that restricts available metrics and fixes project identity. Query validation and response filtering enforce the data boundary beyond dashboard variables or Viewer permissions alone.
An operational layer for the software we build.
Heimdal is in active internal use for monitoring, log and error collection, Telegram alerting, and backup workflows. It supports ongoing investigation and maintenance across projects, with customer-facing views kept separate from operator diagnostics.
Built with
- Grafana
- Prometheus
- Loki
- GlitchTip
- Blackbox Exporter
- Go
- Python
Need visibility into your applications and infrastructure?
We can discuss monitoring, alerting, and operational workflows suited to your services and team.
Discuss your monitoring needs